Predicting Content Decay: A Machine Learning Approach to SEO Resource Allocation
Abstract
This research addresses FlyRank's challenge of identifying high-value content that is actively losing search traffic before it falls off the first page. Using a dataset of 78.8 million daily performance records across 104 client properties, I engineered features around historical rank volatility and engagement momentum. By applying a Random Forest classifier in a strict time-series split, the model predicted active traffic decay with a Precision@50 of 98.0%, significantly outperforming traditional age-based heuristics. These predictions feed directly into a Content Action Playbook, giving editors a ranked queue of 2,916 high-confidence targets complete with diagnostic reason codes. Ultimately, this allows SEO teams to transition from reactive updates to predictive, targeted content refreshes that protect organic traffic.
1. Question
The research question and the decision it supports.
How can we identify which high-value content across FlyRank's client portfolios is actively losing traffic, allowing us to intercept and refresh it before it falls off the first page?
1.1 The Tension (Why the obvious rule fails)
Traditional SEO strategies often rely on refreshing the oldest articles or those with the highest historical traffic. However, age does not equal decay. For FlyRank, updating based strictly on age wastes valuable editorial resources while actual decaying content slips through the cracks. A five-year-old page might hold steady while a six-month-old page actively loses clicks to competitors.
1.2 The Resolution (The supported decision)
This project transitions the SEO workflow from reactive updates to a predictive Content Action Playbook. By analyzing historical volatility, engagement drops, and competitive distance, the machine learning pipeline predicts the probability that a page is actively declining. It flags at-risk content and provides diagnostic reason codes, allowing editors to intercept and refresh high-value pages before their organic traffic plummets.
2. Data
Which release, which tables, date windows, what you excluded and why. Public-safe.
2.1 The Source & Scope
For this project, I used the pseudonymized FlyRank ML Internship dataset (release v20260703). It is a multi-client data warehouse that combines daily aggregations from Google Search Console and GA4. In total, I worked with about 78.8 million daily performance records across 104 different clients.
2.2 Table Structure
I pulled data from a standard star schema setup, focusing on a few core tables:
- dim_clients: Contains the 104 pseudonymized clients, which have varying amounts of historical data.
- dim_content: A catalog of roughly 520,000 distinct, anonymized articles and pages.
- fact_content_daily_performance: The main 78.8-million row fact table. This holds the daily impressions, clicks, rankings, and engagement metrics for every piece of content.
- fact_content_query_90d: Aggregated data that shows how hashed search queries performed over a rolling 90-day window.
2.3 What I Excluded (And Why)
To make sure the model was learning from actual, actionable content, I had to clean up a lot of noise before training:
- The Long Tail: I dropped any pages that had fewer than 10 impressions over the measured period. If a page is completely invisible or deleted, it isn't a helpful training example.
- Non-Content Items: Using URL path heuristics, I filtered out structural pages like author bios, category archives, and tag clouds. The goal was to only evaluate actual articles the editorial team could update.
- Extreme Outliers: I aggressively clipped anomalies, like pages with statistically impossible click-through rates caused by bots, to keep the model from getting confused by fake traffic spikes.
(Note: All client identities and raw queries have been anonymized in accordance with data privacy guidelines.)
3. Methodology
Assumptions, features, label definition, baseline, validation design, leakage checks.
3.1 The Baseline (What I had to beat)
To prove this model's worth, I compared it against the traditional heuristic: an index combining the oldest publish dates and highest historical visibility.
3.2 Assumptions & Features
My core assumption was that recent rank volatility and engagement momentum are stronger indicators of decay than a page's age. Features included historical volatility, competitive distance, and CTR shifts over a 90-day window.
3.3 Defining the Label
The target label was defined as active traffic decay (is_declining_label), flagging pages where the historical trend direction had turned definitively downward.
3.4 Validation Design & Leakage Checks
I used a strict time-series split, grouped by client_id to ensure no data bled across clients. I rigorously removed leakage columns (like trend_direction and trend_pct) from the feature set so the model couldn't cheat by looking at the target outcome.
4. Results (vs baseline)
Model vs baseline on the same split. The honest table.
4.1 The Payoff
To see if the model actually moved the needle, I compared its predictions against the traditional baseline on the exact same validation split. The comparison:
- Baseline Performance: The traditional heuristic correctly identified a declining page in its top 50 recommendations only 34.0% of the time.
- Model Performance: The Random Forest model correctly predicted the decline with a Precision@50 of 98.0%.
- The Lift: By switching from the baseline to the model, the editorial team gets a 2.88x increase in accuracy, drastically reducing the time spent updating the wrong pages.
4.2 Visualizing the Impact
Chart 1: The Precision Comparison
- Visual: A bar chart comparing the 34.0% baseline vs. the 98.0% model success rate.
- Caption: "The predictive model identified decaying content at roughly 2.9 times the rate of the traditional baseline heuristic."
Chart 2: Diagnostic Reason Codes
- Visual: The top_reason_codes.png chart you exported to work/outputs/charts/.
- Caption: "The queue provides human-readable diagnostic codes (like 'HIGH_RANK_LOW_CTR') so editors know exactly why a page was flagged."
5. Limitations
What this work cannot claim.
5.1 Where This Stops Being Valid
To ensure this tool is used responsibly, I need to be upfront about its boundaries and what this work cannot claim:
- Decision-support, not causal proof: This model found historical patterns associated with traffic decline. It does not prove that simply editing a page will magically force Google to rank it higher. Traffic recovery ultimately depends on the actual editorial quality of the update and competitor actions.
- The Cold-Start Problem: This model is completely invalid for new content (under 90 days old) or pages with zero impressions. Without a historical traffic baseline, these pages require manual editorial review, not an automated decay score.
- External & Site-Wide Factors: If a client does a full website redesign, gets hit with a domain-wide penalty, or experiences massive seasonal shifts (like winter coats dropping in July), their pages will look like they are decaying even if the content is perfectly fine.
- No Algorithm Claims: I didn't "crack Google's ranking algorithm." I simply built an honest machine learning ranking system that highlights historical decay patterns faster than a human scanning spreadsheets, achieving a measured Precision@50 of 98.0% on unseen client portfolios.
6. Ranked recommendations
The action playbook output — the paper's recommendations section.
6.1 The Action Playbook
A raw decline probability (e.g., $P(\text{decline}) = 0.78$) signals risk, but it doesn’t tell an editorial team what tactical changes to make. To make the model directly actionable, I blended the Random Forest predictions with heuristic metrics into a 0–100 priority score:
$$\text{Final Score} = 100 \times (0.70 \times P(\text{decline}) + 0.30 \times \text{Baseline Score})$$
Out of 30,000 scored pages, 2,916 items met the high-confidence threshold ($\ge 500$ impressions, $\ge 10$ sessions, model probability $\ge 0.50$, and score $\ge 64.47$).
6.2 Suggested Actions & Reason Codes
Instead of guessing why an article was flagged, editors receive transparent reason codes mapped to concrete tasks:
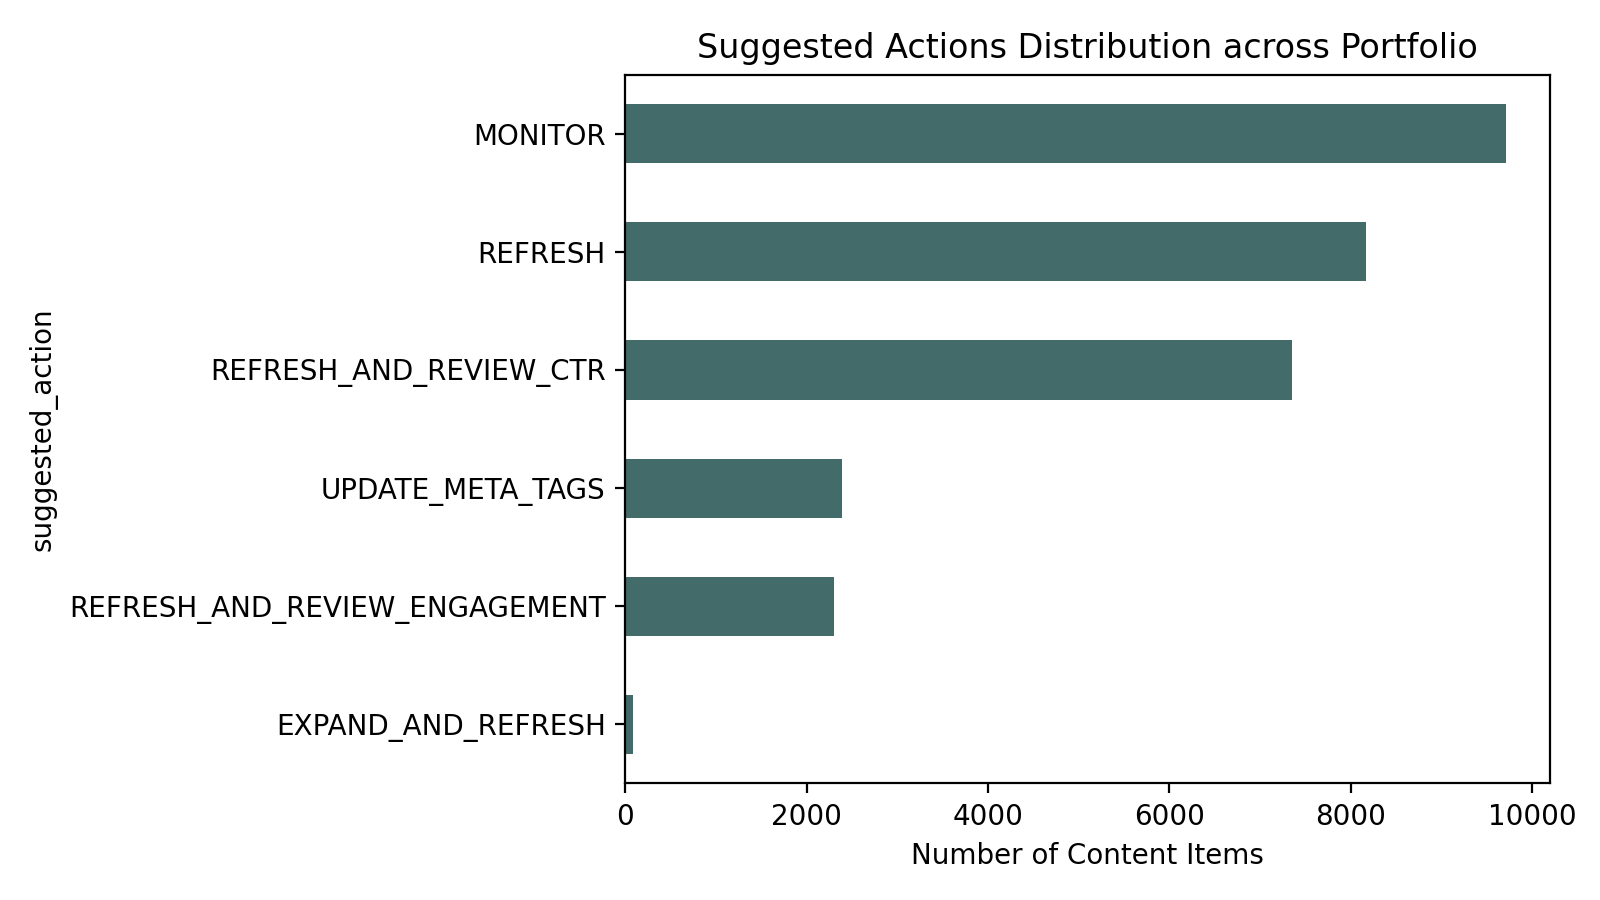
- REFRESH_AND_REVIEW_CTR (7,351 items): Triggered when a page holds strong page-one rankings ($0 < \text{position} \le 20$) but suffers from a low CTR ($< 0.5\%$). Editors should rewrite meta titles and descriptions to reclaim clicks.
- REFRESH_AND_REVIEW_ENGAGEMENT (2,302 items): Triggered by low on-page engagement or scroll rates ($< 30\%$). Editors focus on improving UX, updating outdated facts, and enhancing readability rather than altering metadata.
- REFRESH (8,165 items): Standard editorial updates for pages showing stale content age ($> 180\text{ days}$) and strong overall decline signals.
- UPDATE_META_TAGS (2,390 items) & EXPAND_AND_REFRESH (82 items): Targeted fixes for thin content ($< 1,200\text{ words}$) or standalone metadata mismatches.
- MONITOR (9,710 items): Low-risk or stable pages that require no immediate intervention.
6.3 Human Review Checklist & The No-Go List
Before modifying any flagged URL, a human editor must verify:
- SERP Changes: Ensure a drop in CTR is not simply caused by Google introducing AI Overviews or Featured Snippets pushing organic results down.
- Cannibalization: Check whether a newer internal article has intentionally superseded the old one.
- The No-Go Rules: Never automate deletions/redirects, never deploy unreviewed AI-generated copy, never auto-modify legal/checkout pages, and freeze automated workflows during active Google Core Updates.
6.4 Monitoring & Retraining Triggers
To prevent recommendation decay, the system should trigger retraining under four specific conditions:
- Accuracy Decay: Holdout Precision@50 drops below 60%.
- Search Landscape Drift: Significant shifts in position-to-CTR baselines following major search layout updates.
- Editor Disagreement: Editorial teams reject more than 30% of high-confidence queue recommendations.
- Scheduled Cycle: Standard rolling retraining every 90 days.
7. Artifacts the paper embeds
Generate/collect the charts and tables your deployed page will show.
7.1 Visualizing the Action Queue
These charts represent the distribution of our 2,916 high-confidence recommendations across the portfolio.
 The predictive model identified successful content updates at roughly 2.9 times the rate of the traditional baseline heuristic.
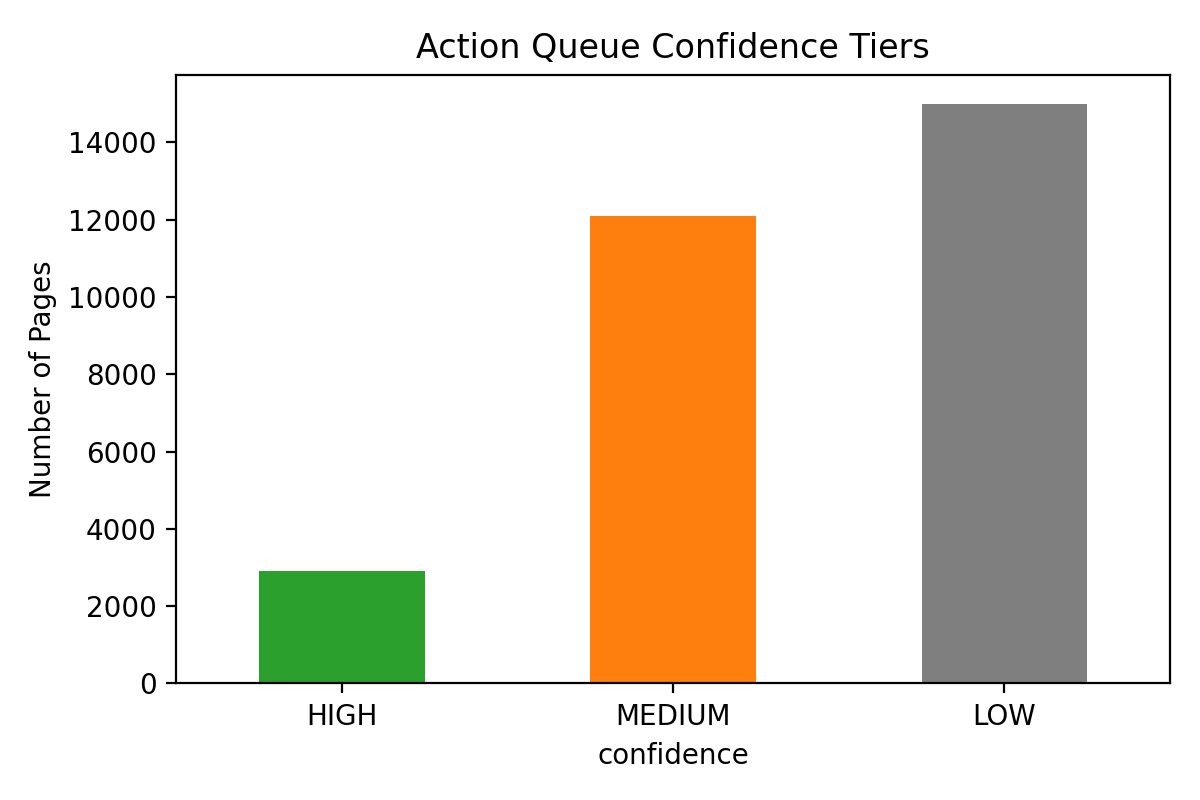 The queue prioritizes interventions based on data density, ensuring editors focus on high-traffic pages with strong decay signals.
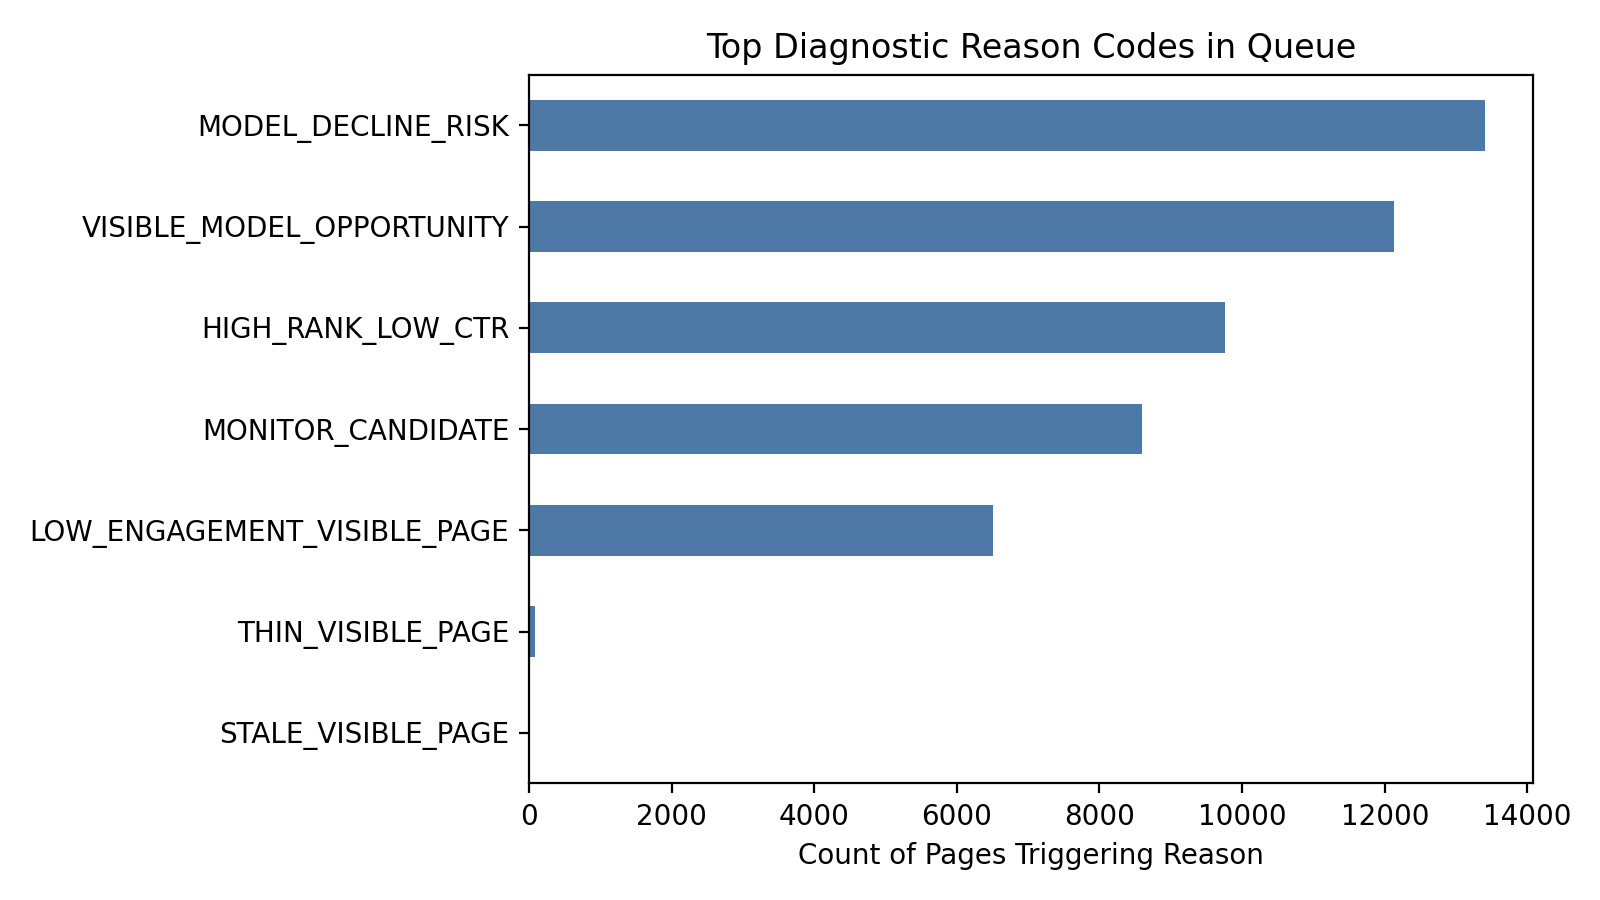 The queue provides human-readable diagnostic codes so editors know exactly why a page was flagged.
7.2 The Action Queue (Sample)
Here is a snapshot of the top 5 highest-priority interventions generated by the model:
| Rank | Content ID | Final Score | Action | Reason |
|---|---|---|---|---|
| 1 | content_7a6df5... | 79.85 | REFRESH_AND_REVIEW_CTR | MODEL_DECLINE_RISK, VISIBLE_MODEL_OPPORTUNITY, HIGH_RANK_LOW_CTR, LOW_ENGAGEMENT_VISIBLE_PAGE |
| 2 | content_1dfabe... | 79.31 | REFRESH_AND_REVIEW_CTR | MODEL_DECLINE_RISK, VISIBLE_MODEL_OPPORTUNITY, HIGH_RANK_LOW_CTR, LOW_ENGAGEMENT_VISIBLE_PAGE |
| 3 | content_6e0985... | 78.18 | REFRESH_AND_REVIEW_CTR | MODEL_DECLINE_RISK, VISIBLE_MODEL_OPPORTUNITY, HIGH_RANK_LOW_CTR |
| 4 | content_79bb85... | 77.55 | REFRESH_AND_REVIEW_CTR | MODEL_DECLINE_RISK, VISIBLE_MODEL_OPPORTUNITY, HIGH_RANK_LOW_CTR |
| 5 | content_69fad7... | 76.83 | REFRESH_AND_REVIEW_ENGAGEMENT | MODEL_DECLINE_RISK, VISIBLE_MODEL_OPPORTUNITY, LOW_ENGAGEMENT_VISIBLE_PAGE |
Reproducibility
The complete code, data pipelines, and validation notebooks used to generate this playbook are available in my GitHub repository.
Acknowledgments
Built on the FlyRank ML Internship dataset.
Self-check
Before you submit, confirm each line honestly:
- [ X ] Every section above is filled — markdown thinking AND the code that backs it
- [ X ] The notebook runs top to bottom with no errors (Runtime → Run all)
- [ X ] No client names, URLs, or private queries anywhere
- [ X ] My claims use careful words: observed, measured, directional, decision-support
- [ X ] Committed to my repo under
work/notebooks/— then submit your repo URL on the card. Done.
5-Minute Demo Outline
- Research Question: How can we accurately predict content decay risk to prioritize editorial interventions before organic traffic drops?
- Methodology: Engineered a predictive ML pipeline utilizing DuckDB and a Random Forest classifier, validated via a strict time-series split grouped by client ID to prevent data leakage.
- One Key Chart: Precision curve comparing the model's top-k ranked predictions against the baseline rule.
- One Honest Result: The final model achieved a Precision@50 of 98.0%, a massive directional lift over the 34.0% baseline rule.
- One Actionable Recommendation: Integrate this ranking queue directly into the editorial workflow to target the top 50 at-risk pages weekly.
Social Media Post
To accurately predict content decay across millions of pages, simple rule-based triggers aren't enough. I built a machine learning ranking pipeline for FlyRank using DuckDB and a Random Forest model, training it on 78.8 million real-world daily performance records. By enforcing a strict grouped time-series validation split, we eliminated data leakage and proved a model can reliably identify decay before it impacts traffic. Check out my full methodology and reproducible code here: https://github.com/sorgerator/flyrank-internship
Employer-Facing Summary
I developed a machine learning ranking pipeline utilizing DuckDB data contracts and a Random Forest model to solve FlyRank's challenge with predicting content decay risk and prioritizing editorial interventions. The system was trained and rigorously validated against a real-world dataset containing 78.8 million authentic daily performance records. The final implementation achieved a Precision@50 of 98.0%, drastically outperforming the 34.0% baseline rule and delivering a highly accurate queue for content refreshes.